
Shuttle Radar Topography Mission
Geophysicist Dr. Ian stewart has kindly prepared for the website radar images of the islands using the 2000 shuttle imagery. An explanation of how this was done follows below the Radar Map Gallery.
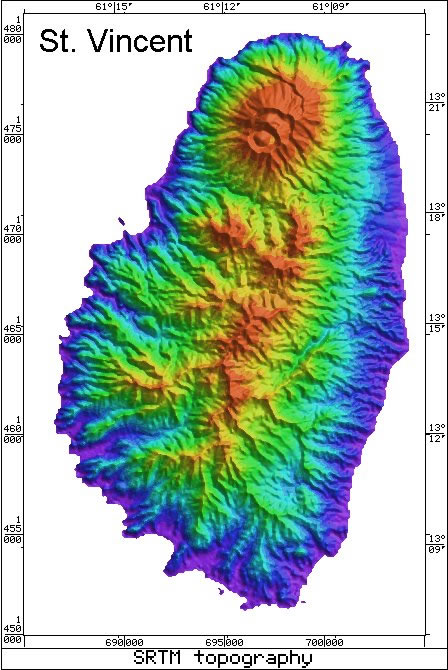
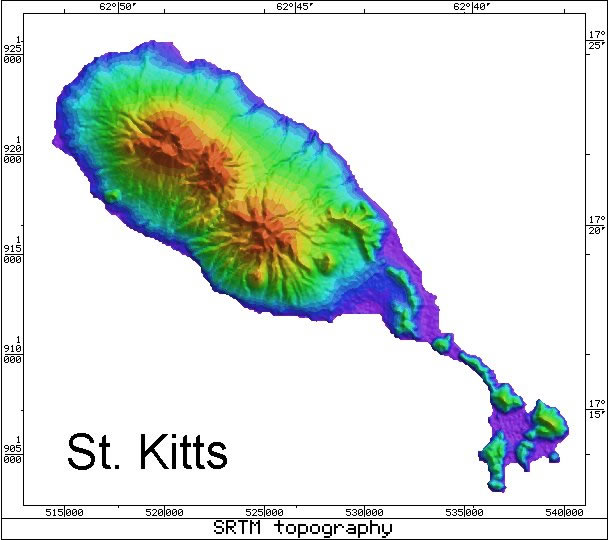
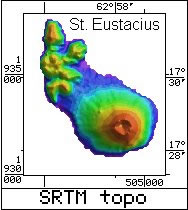
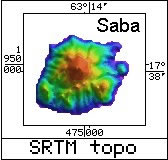
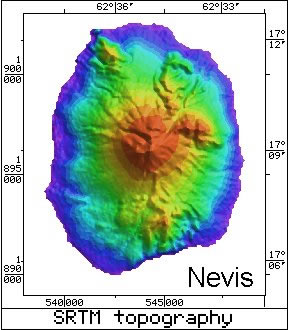
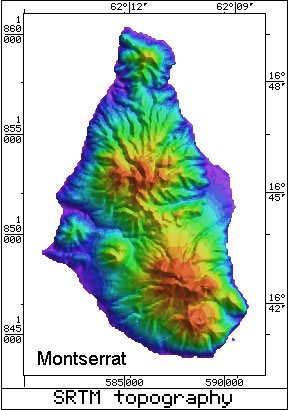
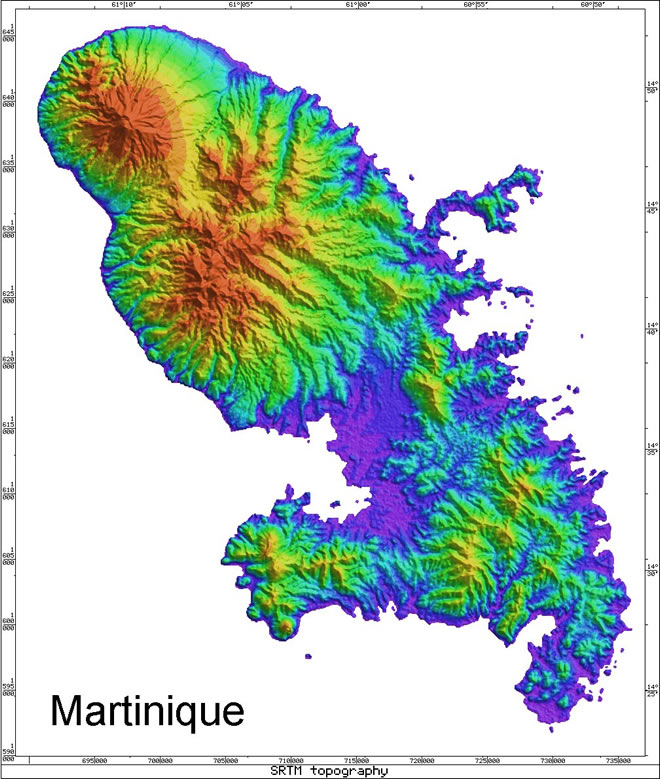
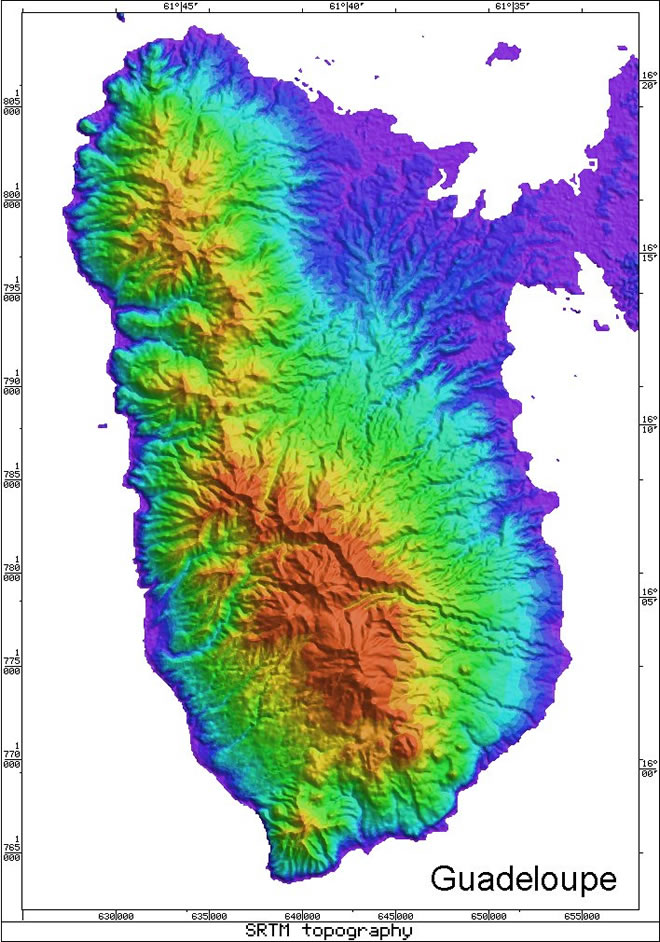
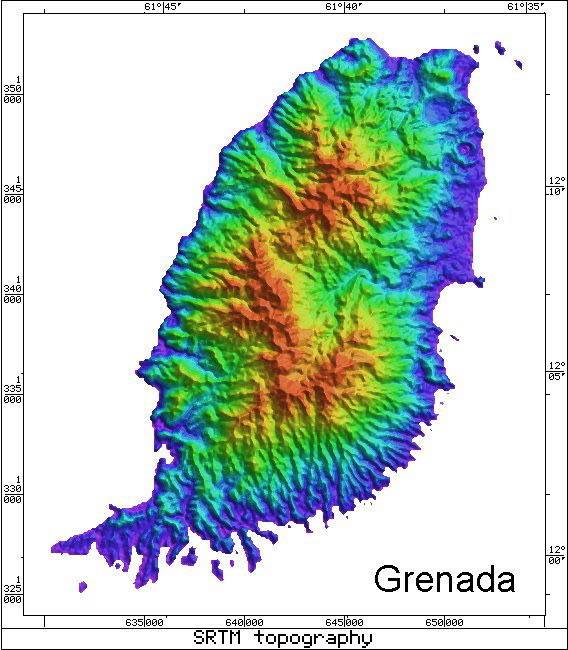
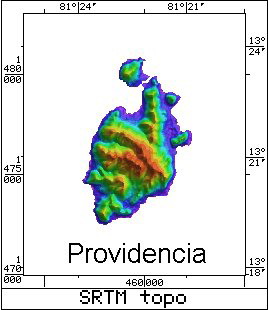
In 2000 radar data was acquired by the space shuttle which enabled virtually complete mapping of the Earth’s topography to be achieved between latitudes 56 o S to 60 o N. A nominal 30 m grid was obtained at an absolute accuracy of 16 m, although in flat non-vegetated areas the vertical accuracy may approach 3 m. While data at the full resolution is available in some regions, such as North America , elsewhere the SRTM data is only provided on an approximately 90 m grid, obtained by averaging the 30 m grid data. The new data is a vast improvement in resolution and accuracy over previous global topographic models, such as ETOPO30, and provides a significant new amount of information of use in geological and other studies.
For the Caribbean islands the SRTM data which is available on a geographic grid at a nominal 90-m cell size was converted to a UTM grid in Zone 20, using the WGS84 spheroid. A grid interval of 50 m was used to retain as much detail as possible, and minor gaps in the data were filled in using special routines. The data were fenced using coastline data obtained from NOAA, and it should be noted that the coastline data set for each island was displaced by up to a kilometre from its location relative to the SRTM grid. This is a reflection on the accuracy of the original geographic information and resulting data sets rather than that of the SRTM data, which is extremely accurately located. Hence the coastline for each island was bulk shifted until it appeared to fit the SRTM data, and was then used to create the final outline shown in these plots. The positions of the coastlines are probably accurate to within about 100 m. The SRTM grids are shown as raster images, with artificial shading by illumination from the northeast, and both UTM and geographic coordinates are included. Non-linear colour scales are used for optimum colour stretch, where low values are purple and high values are red.
For more information contact:
Dr. Ian C.F. Stewart
Stewart Geophysical Consultants Pty. Ltd.
Email: stewgeop@senet.com.au